As I was browsing the Business Insider blog this morning, I ran across an article entitled Tablets Are Becoming More Important Than Smartphones For Online Shopping, But Retailers Aren’t Ready. Interesting stuff. The article includes the following chart:
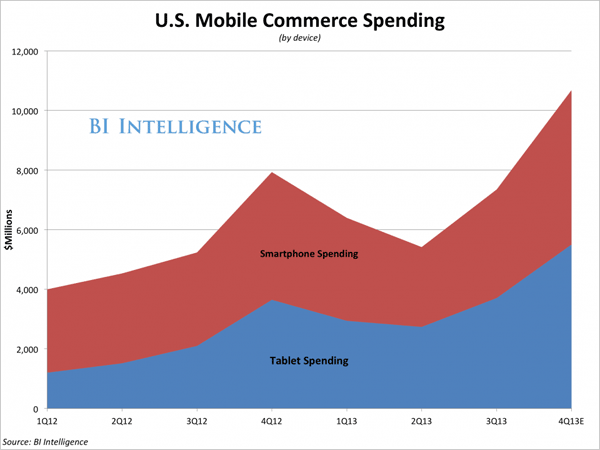
Using the chart, I wanted to answer the following questions:
- How much more important are tablets than smartphones?
- When did this change occur?
The chart makes answering these questions very difficult, but are the two most important questions to answer, given the title of the article. The article is much less about total online mobile shopping revenues and much more about the individual device contributors, rendering a stacked bar chart inappropriate. Besides, if I’m going to try to answer questions about online mobile spending, I’m also going to want to see it in the context of total online spending.
I’ve inferred the following data from the chart above:
| Quarter | Tablets | Smartphones | Total |
| 1Q12 | 1300 | 2700 | 4000 |
| 2Q12 | 1550 | 2950 | 4500 |
| 3Q12 | 2150 | 2850 | 5000 |
| 4Q12 | 3650 | 4250 | 7900 |
| 1Q13 | 2950 | 3450 | 6400 |
| 2Q13 | 2750 | 2650 | 5400 |
| 3Q13 | 3700 | 3650 | 7350 |
| 4Q13E | 5500 | 5100 | 10600 |
With 5 minutes of effort in Excel, I created the following:
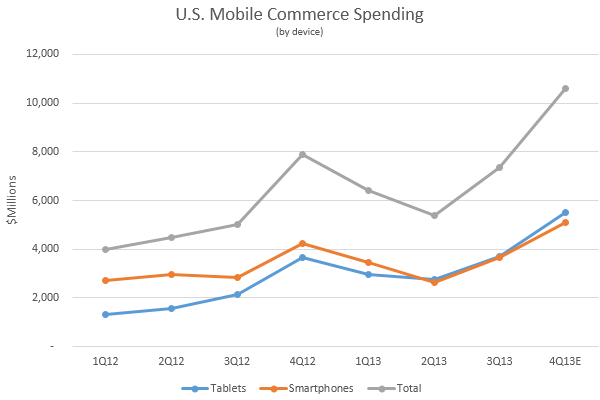
What I notice with this new rendering:
- I can actually see the difference between smartphones and tablets while keeping track of the total as well. I admit that’s trivially easy with only three data series.
- The difference isn’t all that great – the gap between tablets and smartphones closed two quarters ago, and it’s only in 4Q ’13 that the analyst predicts tablet commerce spending to outpace smartphone spending. No empirical evidence yet.
Now let’s remove the final distracting element from this chart – the 4Q holiday season bump. Often it’s much more useful to compare the same quarter or month with that of the previous year(s) as a percent change. This is particularly useful since both segments are growing:

We finally see some useful information from https://www.salesforce.com/blog/2019/04/future-of-ai-artificial-intelligence-business-impact.html! While the growth in the tablet market is slowing, it is doing at least twice as well as smartphones. If anything, I’d say the analyst has been conservative in their estimate of tablet commerce spending for this coming fourth quarter.
I’m awfully curious about what killed smartphone commerce spending in 2Q13 … perhaps a topic for another day.
Just a few hours after blogging this, I found another article on Business Insider that used my suggested visualization, albeit quarter-over-quarter as opposed to year-over-year.